 July
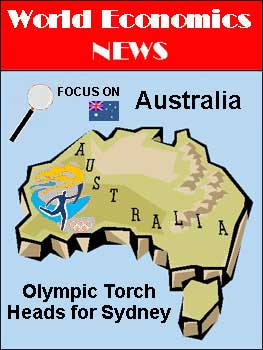
22, 2000 The Olympic torch has already arrived in Australia and
is
working its way around the vast country toward Sydney. The city
will
host the 27th Olympiad for two weeks beginning September 15.
Nearly
200 thousand international visitors are expected to travel to Australia
for the Summer Games, including 10,200 athletes and 5,100
officials.
It's the biggest event ever held in Australia and will put the country
in the international spotlight when television sets around the world
are
tuned-in to watch the competitions.
July
22, 2000 The Olympic torch has already arrived in Australia and
is
working its way around the vast country toward Sydney. The city
will
host the 27th Olympiad for two weeks beginning September 15.
Nearly
200 thousand international visitors are expected to travel to Australia
for the Summer Games, including 10,200 athletes and 5,100
officials.
It's the biggest event ever held in Australia and will put the country
in the international spotlight when television sets around the world
are
tuned-in to watch the competitions.
When the Games begin, the Australian economy will be in its longest
sustained economic recovery in the past two decades -- with no sign of
ending anytime soon. The Games themselves are a boom to the
Australian
economy. One study (Arthur Anderson/CREA, 1999) has estimated
that
the Olympics will add an additional $6.5 billion to Australia's GDP for
the twelve year period 1994-95 to 2005-06.
Hosting the Olympic Games stimulates an economy's exports, tourism,
and other international services (e.g., sponsorship and media broadcast
rights) associated with promoting the Games. Other direct
benefits
include investment spending for infrastructure projects such as Olympic
facilities, airport upgrades, and road and railway improvements.
As a direct consequence of these projects, the unemployment rate in
Australia
has fallen to 6.7% in May from 7.4% a year earlier; and unemployment is
expected to fall further in the months ahead.
While part of Australia's recent economic expansion can be
attributed
to hosting the Olympics, another part can be attributed to the economic
strength of its trading partners. Australia exports approximately
15% of its GDP -- primarily coal, gold, iron ore, aluminum, and
wheat.
Its economy does well when these commodity prices rise and its trading
partners are doing well. With the exception of Japan (1st) and
Indonesia
(10th), Australia's top 10 export market economies are in various
stages
of economic recovery. The United States (2nd) is in its
longest
economic recovery on record. So is the United Kingdom
(5th).
Korea (3rd), Taiwan (6th), China (7th), Singapore (8th) and Hong Kong
(9th)
have all rebounded from the 1997-98 Asian financial crisis. New
Zealand
(4th) is currently growing at a 3-4% annual rate.
The Macroeconmic Performance of Australia
and its Top 10 Trade Partners, 1999
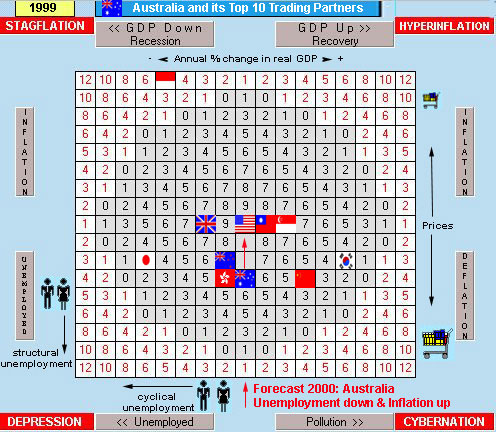
The image above shows the playing field of The
Global Economics Game. It illustrates the
macroeconomic performance of Australia and its top 10
trade partners for 1999. Countries to
the right of the playing field (e.g., Korea) grew
rapidly.
Countries to the left (e.g., Japan) were
in recession. The United States and Australia
grew
at about 4%. Generally, the higher up in
the playing field (e.g., Indonesia) , the higher the
rate of inflation. Structural unemployment is
shown when countries move down the playing field.
Placements
are only an approximation.
Source of Data: IMF. World Economic
Outlook
2000.
According to a recent poll taken by The Economist magazine,
Australia's
economy is forecast to grow at 4.2 per cent this year and 3.7 per cent
next year. However, inflation is also predicted to rise to
4.3%.
Already, the central bank is tightening (interest rates are rising) to
curtail the expected acceleration in prices. There is a great
deal
of uncertainty in Australia revolving around its recent tax reform
measure.
This year marginal income tax rates in Australia were cut
drastically.
For the middle income groups, for example, the marginal tax rate was
cut
from 44.5 per cent to 31.5 per cent. To offset these income tax
cuts,
the government initiated a 10 per cent goods and services tax (GST) on
most items sold in Australia. The GST went into effect on July
1.
Controversy surrounds this ambitious tax reform package, and it will be
an economist's playground to figure out its economic effects in the
years
ahead.
Some have suggested that the recent monetary tightening in Australia
is directly linked to the new tax structure out of fear that it might
precipitate
a wage-price spiral and be inflationary on balance. However, Mr.
IF Macfarlane, Governor, to the Economic Society of Australia,
addressed
the issue in a speech he delivered in Melbourne in February: "I
have
said on a number of occasions and will say so again today -- monetary
policy
was not tightened because of the GST. The tightening would have
happened
without the impending GST, just as it has in the United States, the
United
Kingdom, New Zealand, the Euro Area, Canada, Sweden, etc. We at
the
Reserve Bank are still operating on the assumption that the GST will
affect
prices only on a one-for-one basis, and that wages will not be raised
to
compensate for the GST. The second assumption reflects the fact
that
reductions in income taxes will more than offset the rise in prices due
to the GST."
The Australian Economy: Three Decades of Growth
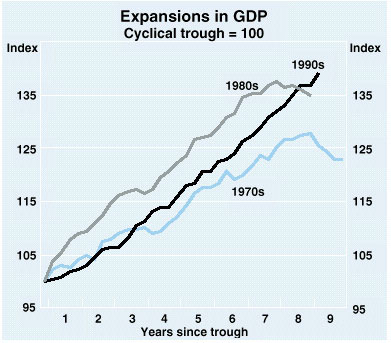
Source: Reserve Bank of Australia
Quite aside from the effects of the GST, it is clear from the graph
above that Australia is experiencing an economic expansion that is
longer
than any other in the previous two decades. Combining the
stimulus
effects of the Olympics and a strong economic performance by its
trading
partners, it would be logical to assume that demand-pull inflationary
pressures
are building up in Australia. It is probably prudent for the
central
bank to lean against the wind and tighten monetary
policy.
The trick is to engineer a "soft landing". Thus, Australia
represents
still another testing ground in the industrialized world to see if
monetary
policy can be used to contain inflationary forces without causing a
recession.
Recommended Links:
Reserve Bank of Australia:
http://www.rba.gov.au
Australian Bureau of Statistics:
http://www.abs.gov.au
Australian Department of Foreign
Affairs
and Trade: http://www.dfat.gov.au
AustradeOnline:
http://www.austrade.gov.au/Australian
Official Site of the Sydney
2000 Olympic Games: http://www.olympics.com
 Periodically,
Economics Education Products sponsors a scholarship
contest for students. The image on the left won first prize
in
our 1999 contest. It was submitted by a high school student in
northern
California (USA). She sketched the picture with colored pencil
and
composed the text file. The diagram illustrates an increase in
aggregate
demand, which expands economic activity (Q) but also causes an increase
in the general price level (P). This current event has been
incorporated
into the 2000 edtion of The Global Economics Game.
You may click on the image to obtain more information about our contest
and view other award winning entries.
Periodically,
Economics Education Products sponsors a scholarship
contest for students. The image on the left won first prize
in
our 1999 contest. It was submitted by a high school student in
northern
California (USA). She sketched the picture with colored pencil
and
composed the text file. The diagram illustrates an increase in
aggregate
demand, which expands economic activity (Q) but also causes an increase
in the general price level (P). This current event has been
incorporated
into the 2000 edtion of The Global Economics Game.
You may click on the image to obtain more information about our contest
and view other award winning entries.
Return
to Home Page Return
to World Economics News
The Global Economics Game (C)
2000
Ronald W. Schuelke All Rights Reserved