 November
28, 2001 As the year 2001 draws to a close, preliminary data
banks
indicate that the global economy will have experienced a dramatic
slowdown
in the rate of growth this year compared to robust growth in
2000.
"GDP growth is now slowing in almost all regions of the globe,
accompanied
by a sharp decline in trade growth," reported the International
Monetary
Fund (IMF) in its World Economic Outlook (October 2001).
November
28, 2001 As the year 2001 draws to a close, preliminary data
banks
indicate that the global economy will have experienced a dramatic
slowdown
in the rate of growth this year compared to robust growth in
2000.
"GDP growth is now slowing in almost all regions of the globe,
accompanied
by a sharp decline in trade growth," reported the International
Monetary
Fund (IMF) in its World Economic Outlook (October 2001).
The global economic slowdown is accentuated by the terrorists
attacks
in the United States on September 11, the delayed economic recovery in
the United States from a recession that "officially" began in March,
weakening
demand and confidence in Europe, another recession in Japan, a decline
in information technology (IT) spending around the world, further
deterioration
of financial conditions for emerging markets (especially Latin
America),
and declining equity markets.
The outlook for 2002 is (as usual) uncertain. Most of the
prominent
economic forecasts for 2002 have recently been revised downward.
However, none are predicting a global recession or depression. The
actual
economic performance next year will depend upon the reaction of
consumers
to the events of 2001, their confidence in the future, the effects of
lower
interest rates worldwide, and the success of the various economic
stimulus
packages in some of the world's biggest economies.
The Global Economy
The global economy is comprised of 177 countries. However, the
largest 17 (about 10%) of those countries produce 75% of the world's
gross
domestic product (GDP). The United States alone accounts for 22%
of world output. Thus, only a few countries primarily determine
the
course of the global economy. Last year, those 17 economies grew
at a weighted average annual rate of 4.7 per cent. This year they
will have grown by a mere 2.5 per cent. Next year, most of them
are
projected to grow slower than 2.0 per cent.
The table below shows the real GDP, inflation rate, and unemployment
rate for the world's 17 largest economies. The United States is
expected
to grow by only 1.3 per cent this year compared to 4.1 per cent last
year.
China, the world's 2nd largest economy, will have increased production
by 7.5 per cent in 2001. It is the fastest growing economy in the
group. Japan, now in its fourth recession in a decade, will have
decreased production by -0.5 per cent in 2001. India, the world's
4th largest economy, is growing at 4.5 per cent this year. The
European
trilogy of Germany, France, and Italy will have increased production
this
year by 0.8, 2.0, and 1.8 per cent, respectively. Rounding out
the
top 7, the United Kingdom expects to see 2.0 per cent growth for the
year
2001.
Real GDP, Inflation, and Unemployment --
2000
and 2001
The Largest 17 Countries in the World
|
Flag
|
Country
|
% of
World GDP*
|
growth
2000
|
growth
2001
|
inflation
2001
|
unemployment
(latest month)
|

|
United States |
22.0
|
4.1 %
|
1.3 %
|
3.2 %
|
5.4 % (Oct)
|

|
China |
11.5
|
8.0 %
|
7.5 %
|
1.0 %
|
N.A.
|

|
Japan |
7.3
|
1.5 %
|
-0.5 %
|
-0.7 %
|
5.3 % (Sept)
|

|
India |
4.6
|
6.0 %
|
4.5 %
|
3.6 %
|
N.A.
|

|
Germany |
4.5
|
3.0 %
|
0.8 %
|
2.5 %
|
9.5 % (Oct)
|

|
France |
3.2
|
3.4 %
|
2.0 %
|
1.8 %
|
9.1 % (Sept)
|

|
United Kingdom |
3.1
|
3.1 %
|
2.0 %
|
2.2 %
|
5.1 % (Aug)
|

|
Italy |
3.1
|
2.9 %
|
1.8 %
|
2.6 %
|
9.4 % (July)
|

|
Brazil |
2.7
|
4.5 %
|
2.2 %
|
6.2 %
|
N.A.
|

|
Russia |
2.5
|
8.3 %
|
4.0 %
|
22.1 %
|
N.A.
|

|
Canada |
1.9
|
4.4 %
|
2.0 %
|
3.1 %
|
7.3 % (Oct)
|

|
Mexico |
1.9
|
6.0 %
|
0.8 %
|
6.3 %
|
N.A.
|

|
Spain |
1.7
|
4.1 %
|
2.7 %
|
3.6 %
|
13.0 % (Sept)
|

|
South Korea |
1.7
|
8.8 %
|
2.5 %
|
4.4 %
|
N.A.
|

|
Indonesia |
1.5
|
4.8 %
|
3.0 %
|
10.8 %
|
N.A.
|

|
Australia |
1.1
|
3.8 %
|
2.3 %
|
4.2 %
|
7.1 % (Oct)
|

|
Taiwan |
1.0
|
6.0 %
|
-1.0 %
|
0.1 %
|
N.A.
|
|
All 17 |
75.3
|
4.7 %
|
2.5 %
|
N.A.
|
N.A.
|
* Purchasing Power Parity (PPP) basis for GDP
conversions
to common (US dollar) currency.
Sources: IMF. World Economic Outlook (October
2001)
and The Economist Magazine (Nov 10-16 2001)
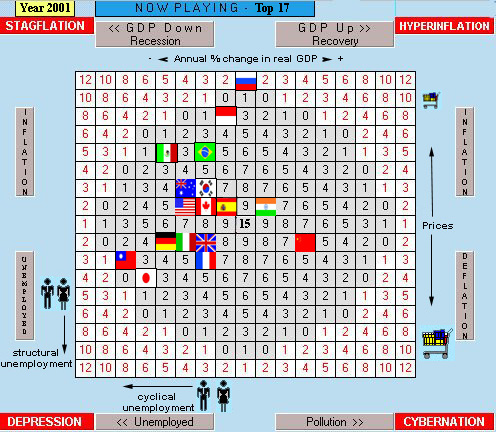
The visual image below depicts the playing field of The
Global
Economics Game and the relative economic performance of the
world's
largest 17 countries in 2001. The further to the right a
country/flag
is, the faster the rate of growth. The very center is
approximately
4 per cent real growth. When a country moves to the left of the
playing
field, the economy's rate of growth slows down and it can slip
into
recession (as in the case of Japan). Declining GDP causes
cyclical
unemployment. The higher up in the playing field a country goes, the
higher
the rate of inflation. For example, Russia's inflation rate is
22.1%.
The middle of the playing field is assumed to be approximately 2.5%
annual
inflation. Differences in the natural rate of unemployment for
different
countries can cause incongruities regarding inflation and unemployment
trade-offs. [Editor's note: The numbers in the playing field
indicate
a country's score as it attempts to balance growth, pollution,
inflation,
and unemployment. Black numbers are positive; red numbers are
negative.
The objective is to land in or near the center square. Placement of
countries
on the playing field based on IMF statistics is only an approximation.]
Source: IMF. World Economic Outlook (October 2001)
Output Gaps
It is clear from the image above that the major industrialized
economies
in the world have experienced a dramatic slowdown in their rates of
growth
in 2001. [They have moved to left side of the playing
area].
Virtually all of them have what economists call a recessionary output
gap.
An output gap is the difference between a country's actual GDP
and
its potential GDP. If the actual GDP is greater than an economy's
potential GDP (assuming a natural rate of unemployment), then the
economy
is experiencing an inflationary output gap. If the actual
GDP is lower than the economy's potential GDP, then the economy has a recessionary
output gap. The table below shows the IMF's estimated output gaps
for selected countries in the year 2001. The table shows, for
example,
that Japan's actual GDP in 2001 is 4.8% below its potential GDP.
Output Gaps: Selected Countries 2001
|
|
Australia |
-0.6
|
|
|
Canada |
-0.6
|
|
|
China |
-4.7
|
|
|
France |
-0.8
|
|
|
Germany |
-1.5
|
|
|
Italy |
-2.0
|
|
|
Japan |
-4.8
|
|
|
South Korea |
-2.5
|
|
|
Spain |
+0.0
|
|
|
Taiwan |
-4.9
|
|
|
United Kingdom |
-0.3
|
|
|
United States |
-0.5
|
Source: IMF. World Economic Outlook (October
2001)
Recessionary output gaps cause cyclical unemployment. More
workers
begin to lose their jobs as employers cut back production. On the
other hand, recessionary output gaps dampen the threat of
inflation.
It is clear from the economic data for 2001 that the world is more
concerned
about declining output and rising unemployment than it is concerned
about
inflation. Also, recessionary output gaps correlate with
declining
revenues and profits for business enterprises.
Equity Markets
The year 2001 has not been kind to equity markets. Stock
market
investors around the world have suffered losses this year. Three
notable exceptions are Mexico, South Korea, and Russia. The table
below shows the percentage declines (-) or advances (+) in selected
stock
market indices from December 31, 2000 to November 7, 2001.
Selected Stock Markets
% Change Dec. 31, 2000 to November 7, 2001
(in US $ terms)
| Australia (All Ordinaries) |
-6.2
|
| Brazil |
-39.4
|
| Britain (FTSE 100) |
-17.8
|
| Canada (Toronto Composite) |
-24.5
|
| France (SFB 250) |
-27.1
|
| Germany (Xetra DAX) |
-27.6
|
| Japan (Nikkei 225) |
-29.6
|
| Mexico |
+4.1
|
| South Korea |
+9.5
|
| Russia |
+44.7
|
| United States (DJIA) |
-11.4
|
| United States (Nasdaq Comp) |
-25.6
|
Source: The Economist Magazine (Nov.
10-16
2001)
The Wealth Effect and Consumer Confidence
Falling output, eroding profits, rising unemployment, and declining
stock prices undermine consumer confidence. The wealth effect
refers to how people behave when they suffer losses in wealth.
When
stock prices fall, for example, stock holders have experienced a
decline
in their net worth. When people feel poorer, they have less
confidence
and tend to spend less as consumers. Declining consumption
expenditures
can cause a recession or aggravate an economic slowdown. However,
confidence levels can sometimes be restored with deliberate simulative
economic policies.
Economic Policies -- Monetary and Fiscal
When market oriented economies experience an economic slowdown,
government
policy makers have essentially two choices. One is to do nothing
and wait for natural market incentives to bring about an economic
recovery.
This is called laissez faire policy -- leave the economy
alone.
A surprisingly large percentage of economists adhere to this school of
thought. To be fair, however, they advocate this policy
consistently
and are quick to point out that many recessions have been caused by
restrictive
economic policies (such as an overly tight monetary policy). If a
recession has been caused by ill-timed or overly restrictive policies,
then it would be necessary for government policy makers to correct
their
mistake.
The other choice for policy makers is to continually monitor and
actively
participate in the economy's overall performance. That is, for
example,
to undertake simulative policies when the economy slows down or falls
into
a recession. Most governments around the world seem to have adopted
this
thinking in response to the 2001 economic slowdown.
The two major economic policy tools available to governments are
monetary
and fiscal policy. Monetary policy refers to the control of
money,
credit, and interest rates. Fiscal policy refers to government
spending
and tax policy. Monetary policy has the advantage of rapid
implementation.
Independent central banks can act quickly. Monetary policy has
the
disadvantage of a long effect lag. That is, it can take a long
time
before the economy responds to a given monetary policy. Fiscal
policy
has the disadvantage of political gridlock. It can take a long
time
before budget bills and stimulus packages can work their way through a
democratic congress. Also, governments that are already
handcuffed
by a relatively large debt find it difficult to deficit spend.
Fiscal
policy has the advantage of a fairly rapid multiplier effect once
government
spending is actually increased and/or taxes are cut.
Monetary authorities around the world have been quick to respond to
the economic slowdown of 2001. They have added liquidity to their
economies, and interest rates have fallen dramatically for the past
year.
The table below shows per annum interest rates for 3-month money market
instruments on November 7, 2001 compared to the same rates one year
earlier.
The Federal Reserve Bank in the United States has been particularly
aggressive,
increasing the broad measure of the money supply by nearly 12% over the
past twelve months. The 3-month money market rate has fallen in
the
United States from 6.50% to 2.02%.
Interest Rates: 3-mth money market
(per annum)
|
Country
|
Nov. 7, 2001
|
Year Ago
|
| Australia |
4.22
|
6.38
|
| Britain |
4.00
|
6.06
|
| Canada |
2.20
|
5.68
|
| Denmark |
3.75
|
5.55
|
| Japan |
0.02
|
0.47
|
| Sweden |
3.57
|
3.98
|
| Switzerland |
2.04
|
3.50
|
| United States |
2.02
|
6.50
|
| Euro Area |
3.37
|
5.17
|
Source: The Economist Magazine (Nov.
10-16
2001)
Fiscal stimulus packages are also being implemented in Europe, the
United
States, Asia, and Latin America. The United States plans to spend
more on its war on terrorism, and an economic stimulus package
authorizing
more government spending and tax cuts is currently finding its way
through
the US congress. The United States has seen its budget surpluses
evaporate and is apparently willing to deficit spend to turn its
economy
around.
Outlook for the Year 2002
According to the IMF, "Substantial uncertainties and risks persist
[for
the year 2002], as the downturn makes the world more vulnerable to
further
unexpected developments, and a significant danger of a deeper and more
prolonged slowdown remains." However, if the combination of lower
interest rates, fiscal stimulus packages, and restored confidence were
to prevail, then the global economy could experience a mild economic
recovery
next year.
Sources and Recommended Links
http://www.imf.org/
http://www.economist.com/
Return
to Home Page Return
to World Economics News
The Global Economics Game (C)
2000
Ronald W. Schuelke All Rights Reserved