 April
1999 The global economy was stunned by the Asian recession of
1998.
Each quarterly report painted a gloomier picture. By the end of
the
year, it was clear that the Asian economy had collapsed. Country
after country saw their economies recede from positive to negative
growth
rates. Only China appears to have avoided the crisis so far.
April
1999 The global economy was stunned by the Asian recession of
1998.
Each quarterly report painted a gloomier picture. By the end of
the
year, it was clear that the Asian economy had collapsed. Country
after country saw their economies recede from positive to negative
growth
rates. Only China appears to have avoided the crisis so far.
Many of the Asian economies had been considered to be modern miracles. For decades they had been growing rapidly, exceeding 10% annual growth in some instances. Four of the countries (South Korea, Hong Kong, Taiwan, and Singapore) were nicknamed the Asian Tigers to reflect the strength and endurance of their economic systems. Rapid growth entails some costs. Many Asian economies have severe pollution problems as well as social problems associated with unequal income distribution.
Given the current recession, the key questions now are: (1) how deep will be the decline, (2) for how long will the malaise last, and (3) to what degree will the Asian economic crisis affect Europe, the United States, and the rest of the world. Consumer and business confidence is naturally very low, and that can't help. During bad times, consumers generally try to save more, but that only makes the problem worse. It's called the paradox of thrift. Saving is not spending. When spending falls, production and incomes fall.
Japan and China are pivotal to the Asian outlook. They could either lead the continent to economic recovery or follow it to depression. Both economies are large and important enough to make a difference.
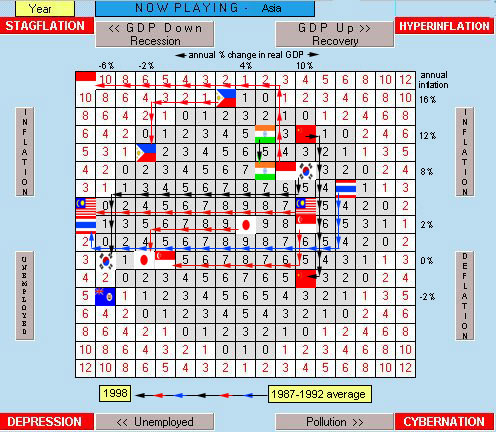
It's sometimes easy to confuse cyclical fluctuations and secular trends. The long-term prospects for Asia are still bright in the opinion of most economists. But the duration of the current crisis is a concern. Five of the eleven economies pictured below are now in the red zone. That means they would get a negative score for their cyclical performance in The World Game of Economics. If that trend continues for a sustained duration, they could pull the rest of the world down with them.
Annual Growth and Inflation for Selected Asian Economies 1987-92 and 1998
|
|
1987-1992 |
1998 |
1987-1992 |
1998 |
1987-1992 |
1998 |
| Taiwan |
|
|
|
|
|
10 |
| India |
|
|
|
|
|
6 |
| China |
|
|
|
|
|
4 |
| Singapore |
|
|
|
|
|
4 |
| Japan |
|
|
|
|
|
3 |
| Philippines |
|
|
|
|
|
1 |
| S. Korea |
|
|
|
|
|
-1 |
| Thailand |
|
|
|
|
|
-1 |
| Malaysia |
|
|
|
|
|
-2 |
| Hong Kong |
|
|
|
|
|
-3 |
| Indonesia |
|
|
|
|
|
-12 |
Recommended Link: http://www.stern.nyu.edu/~nroubini/asia/AsiaHomepage.html
The World Game of Economics (C) 1999 Ronald W. Schuelke All Rights Reserved