Position of Countries in the Playing Field
 April
25, 1999 -- The global economy began to slow down in 1998, due largely
to the problems of emerging markets in Asia, Latin America, and
Russia.
Most economic forecasts for 1999 suggest even slower global economic
growth
this year, but few are predicting worldwide recession.
April
25, 1999 -- The global economy began to slow down in 1998, due largely
to the problems of emerging markets in Asia, Latin America, and
Russia.
Most economic forecasts for 1999 suggest even slower global economic
growth
this year, but few are predicting worldwide recession.
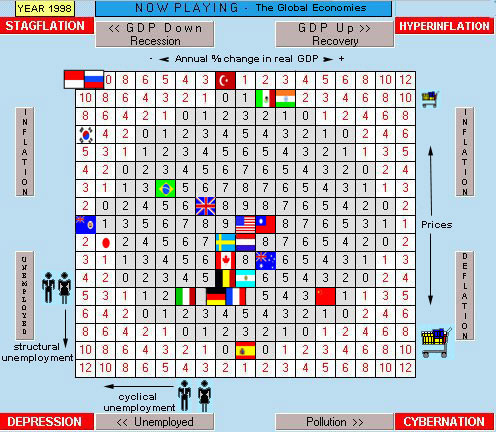
The United States was the strongest economy in the world in 1998. It anchored the rest of the world against global depression and gets the highest possible rating (10 points). Americans continue to buy more merchandise from the rest of the world than they sell, due in part to the strength of the dollar. Last year was the largest U.S. merchandise trade deficit on record.
Among the other industrialized nations, the United Kingdom had the highest inflation rate, and Spain had the the highest unemployment. France and Germany grew at 3% with less than 1% inflation, but structural unemployment continued to plague these two countries. The EU initiated the European Monetary Union (EMU) and the Euro currency unit in January of this year. Meanwhile, Japan (the world's second largest economy) is attempting to repair its banking industry and implementing a stimulus package to combat its worst recession in decades. Japan's GDP fell by nearly 3% in 1998.
Among the third world countries and economies in transition, China continued to experience a rapid rate of economic growth and development in spite of the collapse of the other Asian economies. Russia was trapped in a classic case of severe stagflation. Brazil was drained of foreign exchange reserves and was in recession by the end of the year. In January of this year, Brazil devalued the real. Mexico's economy continued its economic recovery, but it suffered from double-digit inflation.
The screen below displays the economic performance for a selection of countries in 1998. Countries to the left side of the playing area were in recession. Those to the right grew rapidly. Countries at the top of the playing area had high inflation. Inflation diminishes as countries move down the field. Cyclical unemployment increases as countries move to the left, and structural unemployment increases as countries move down the playing area. Landing in the center is an optimal balance of growth, pollution, inflation, and unemployment.
Position of Countries in the Playing Field
[Note: Drawing international comparisons among countries
regarding
growth, pollution, inflation, and unemployment is unusually tricky and
extremely difficult. Beyond the problems of data gathering and
reporting
techniques, individual countries have different short-run trade-offs
between
inflation and unemployment, and they have different natural rates of
unemployment.
Therefore, the placement of countries in the playing field above is
only
an approximation based on 1998 country statistics. (See Table
Below).
When playing The World Game of Economics, these
differences
are assumed to be small or nonexistent. That's unrealistic, but
it's
done for simplicity, so that the game does not become overly complex].
|
|
|
|
|
|
| 3.9 % | 4.5 % | 1.6 % |
|
|
| 4.9 % | 2.8 % | 1.7 % |
|
|
| 3.7 % | 5.3 % | 2.0 % |
|
|
| 2.9 % | 6.5 % | -0.1 % |
|
|
| 2.9 % | 6.2 % | 1.7 % |
|
|
| 3.3 % | 6.4 % | 0.9 % |
|
|
| 2.1 % | 4.7 % | 2.7 % |
|
|
| 5.1 % | 8.0 % | 1.5 % |
|
|
| 4.2 % | N.A. | 0.9 % |
|
|
| 3.0 % | 8.1 % | 1.2 % |
|
|
| 2.9 % | 8.8 % | 1.0 % |
|
|
| 2.8 % | 11.2 % | 0.9 % |
|
|
| 3.1 % | 11.6 % | 0.7 % |
|
|
| 0.2 % | 6.0 % | 3.5 % |
|
|
| 1.4 % | 12.3 % | 1.8 % |
|
|
| 7.8 % | N.A. | - 0.8 % |
|
|
| 3.8 % | 18.8 % | 1.8 % |
|
|
| -2.8 % | 4.1 % | 0.6 % |
|
|
| 4.9 % | N.A. | 16.7 % |
|
|
| 5.6 % | N.A. | 13.0 % |
|
|
| -5.1 % | 4.7 % | 2.6 % |
|
|
| 2.8 % | N.A. | 84.6 % |
|
|
| -5.5 % | 8.0 % | 7.5 % |
|
|
| -4.8 % | N.A | 84.0 % |
|
|
| -13.7 % | N.A. | 60.7 % |
|
Recommended Link: International Monetary Fund
The World Game of Economics (C) 1999 Ronald W. Schuelke All Rights Reserved