Accelerating
Inflation: Demand-Pull or Cost-Push?
The rate of inflation accelerated in 2004 in about half of the
countries depicted in Figure 1. This is not surprising, because
empirical research in economics indicates that inflation begins to
increase when an economy's recovery moves its output closer and closer
to its full-employment, potential GDP. It is called demand-pull
inflation. It is also not surprising that inflation is on the
rise in many countries, because oil prices also rose in 2004.
Higher oil prices can cause inflation, because oil is the world's
principal source of energy and production costs increase for many goods
and services when oil prices rise. This is called cost-push
inflation.
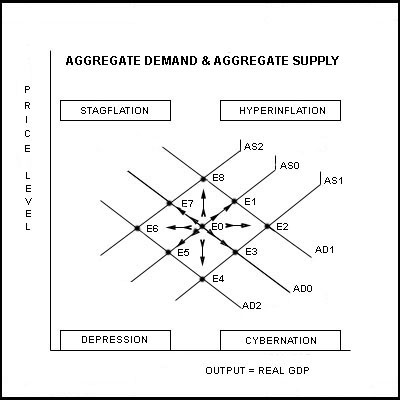
The analytical diagram in Figure 2 below depicting the model of
Aggregate Demand (AD) and Aggregate Supply (AS) can be used to see the
difference between demand-pull and cost-push inflation. If an economy
is initially at E5 in the diagram, then an increase in Aggregate Demand
(AD) from AD2 to AD0 would move the economy along the Aggregate
Supply (AS0) curve from E5 to E0. The country's real GDP would
increase, and prices would be
pulled
up by the increased demand. If the economy were
subsequently hit by an adverse oil price shock, then the AS curve would
shift from AS0 to AS2 and the economy would move from E0 to E7 along
the AD0 curve. The real GDP would contract, but prices would be
pushed up by the higher oil prices.
Figure
2
Higher oil prices in the mid-1970s caused severe global stagflation --
the combination of recession and inflation. Economies around the
globe were hurled from E0 toward E7 and beyond in Figure 2. In
contrast, oil prices rose rather dramatically in 2004 (See Figure 3
below), but the adverse impact on output and prices was much smaller
than in the 1970s.
Figure
3
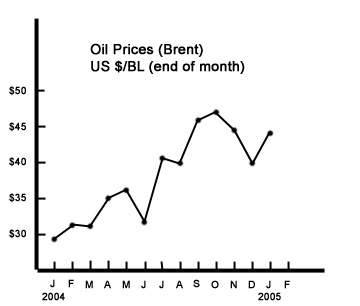 Source: U.S. National Energy Information Center
The adverse impact of higher oil prices in 2004 was less severe than in
the mid-1970s for several reasons: (1) Many economies are now less
dependent on oil as a per cent of total GDP than they were in the
1970s. This means they are less vulnerable to cost-push inflation
arising from an adverse oil supply shock. For example, oil
expenditures were about 10 per cent of United States GDP in the 1970s,
compared to only 3 per cent in 2004. (2) The percentage increases
in oil prices in the mid-1970s were very high, exceeding 100, 200, and
300 per cent. Today, an increase in the price of oil from $30 to
$50 is still only a 66 per cent increase. (3) The oil price
increases in the 1970s were not being offset by increases in
productivity in other sectors. Today, productivity increases are
being driven by information technology and globalization. (4) The
oil price increases in the mid-1970s caused aggregate supply to
decrease by more than any increases in aggregate demand. As a
result, not only did inflation increase, but output fell as well.
In 2004, it appears that increases in aggregate demand were the greater
force so that real GDP increased in spite of any decrease in aggregate
supply due to higher oil prices. This would explain why most
countries around the world grew so rapidly in 2004. Higher oil
prices failed to stall the global economic recovery in 2004.
The
Outlook for 2005
If oil prices were to go up again in 2005 at the same rate that they
did in 2004, say from US $45/bl to $60/bl, then they might begin to
have more severe adverse consequences on the global economy.
However, most analysts don't expect to see this happen. A more
likely development in 2005 is the probable rise in interest rates as
central banks around the world begin to fear accelerating inflation and
try to take the steam out of aggregate demand. When central
bankers expect higher and unacceptable rates of inflation, they try to
engineer "soft landings" with tighter money. Already, short-term
interest rates in the United States have gone up from 1 per cent a year
ago to 2.6 per cent today. It's a tricky assignment to cool down
an economy without going too far and causing a recession.
Return
to Home Page Return
to World Economics News
The Global Economics Game (C)
2000-2004
Ronald W. Schuelke All Rights Reserved
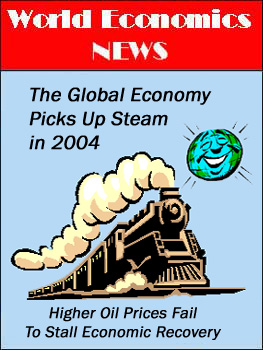 February 18, 2005 -- The initially
anemic global economic recovery from the 2001/02 recession really
picked up steam in 2004. Virtually every major economy in North
America, South America, Europe and Asia grew faster in 2004 than in
2003.
February 18, 2005 -- The initially
anemic global economic recovery from the 2001/02 recession really
picked up steam in 2004. Virtually every major economy in North
America, South America, Europe and Asia grew faster in 2004 than in
2003.