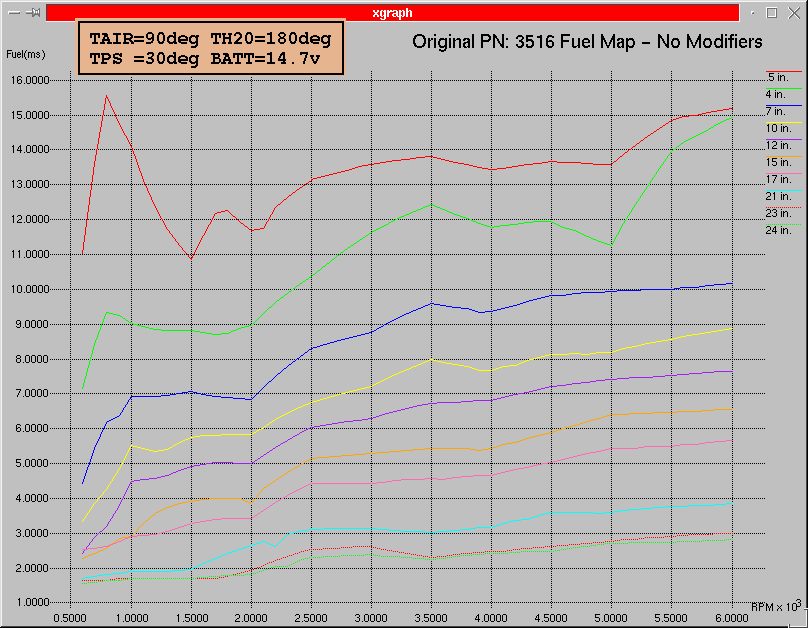
Here are a couple of maps that show the relationship between Fuel Pulse Width vs RPM for several load lines. Note that the load lines are in Controller displayed Vacuum units and Not MAT units. These vacuum units represent the air charge going into the engine. These plots were all generated using my simulator (emux). After the test conditions were set and a certain load (vacuum) set, the RPM was varied across the band and the output pulse width was recorded. What this means is that these plots represent the actual pulse widths that the code generated not just what the fuel tables said. This seemed to be the most accurate way of seeing what the code was doing.

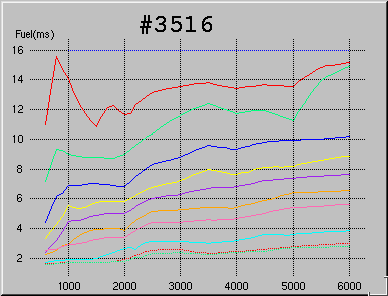
This is the unmodified Fuel map for my original #3516 code. This is the raw map with all the user fuel modifiers set to zero so this is what you will get if you do nothing. Notice the dips around 2000 RPM. All my user modifiers were in the plus range to try to pull up these regions. The next plot shows how the modifiers did their job. I my modified code I pulled up all these areas and reset the modifiers back to zero. I don't know why they were set so lean but it sure made my combination run poorly.
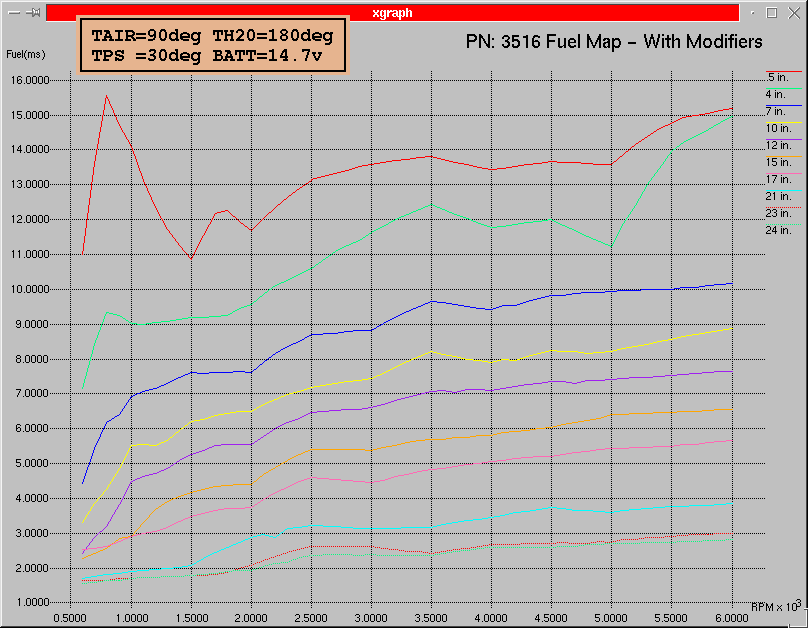
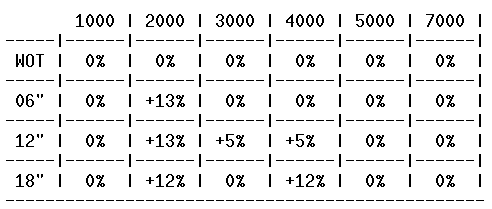
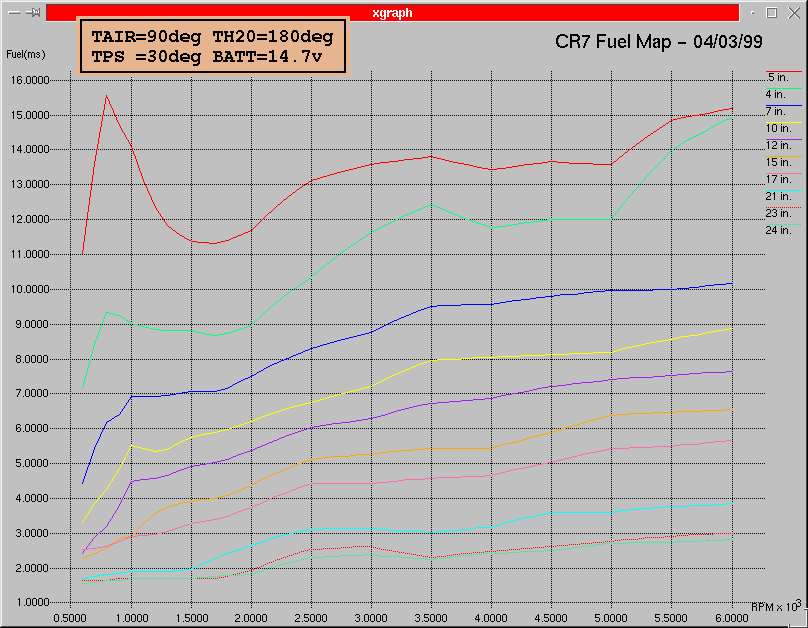
This plot shows what I'm currently running. You can see the the area around 2000 RPM has been pulled up and the curves are generally smoother. Don't know why the original curves are so jagged.
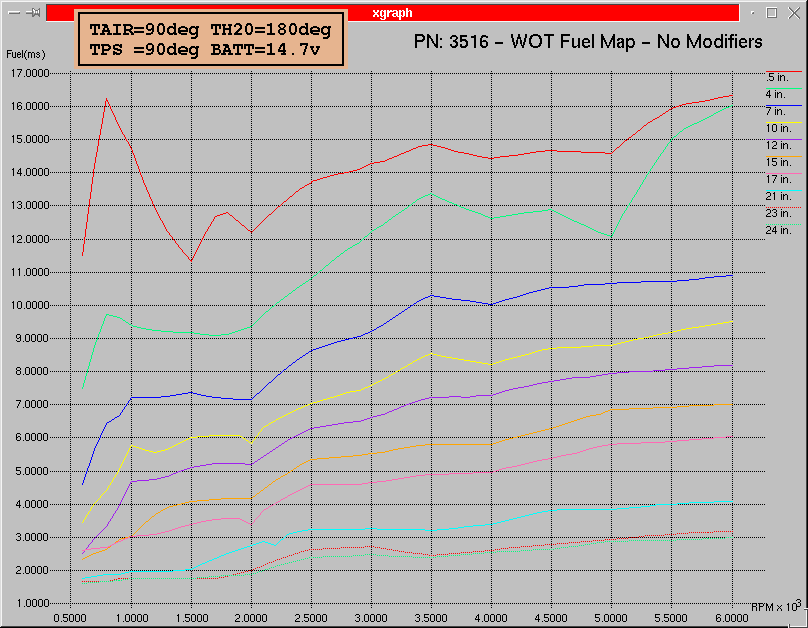
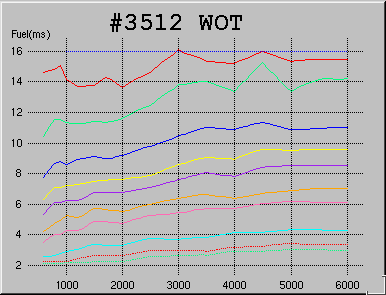
And this last plot is for WOT.......
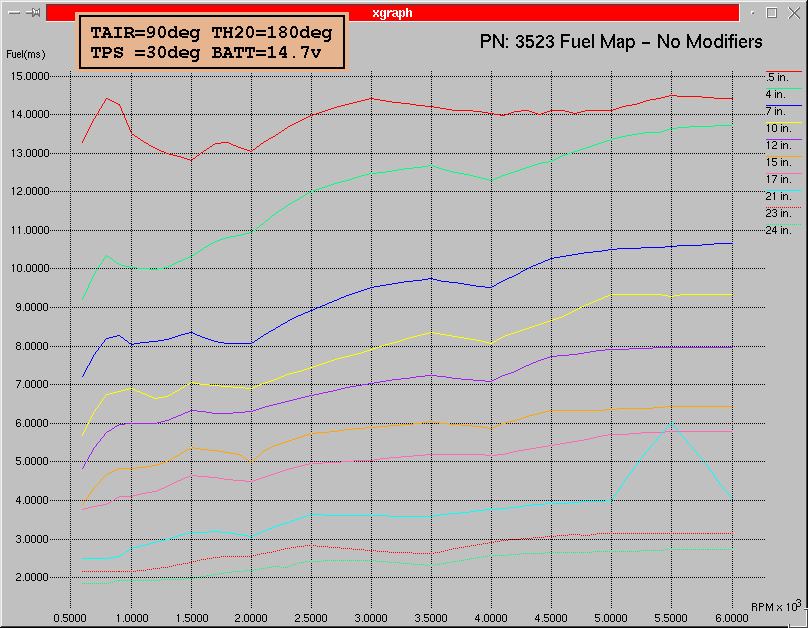
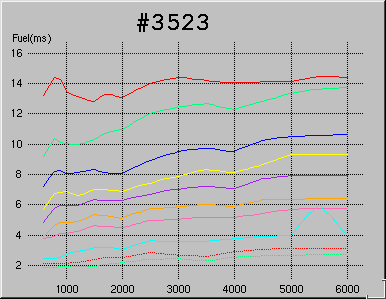
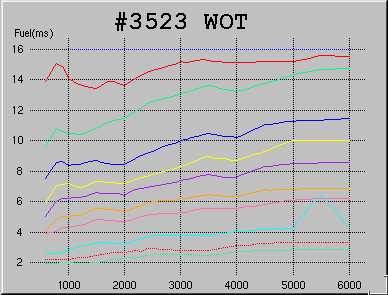
Well this is the Fuel Map for the #3523 code set. This is raw plot so no user fuel modifiers are being applied. Also not that weird glitch in the 21 in. line at 5500 rpm is real. Looks like someone goofed a little here.
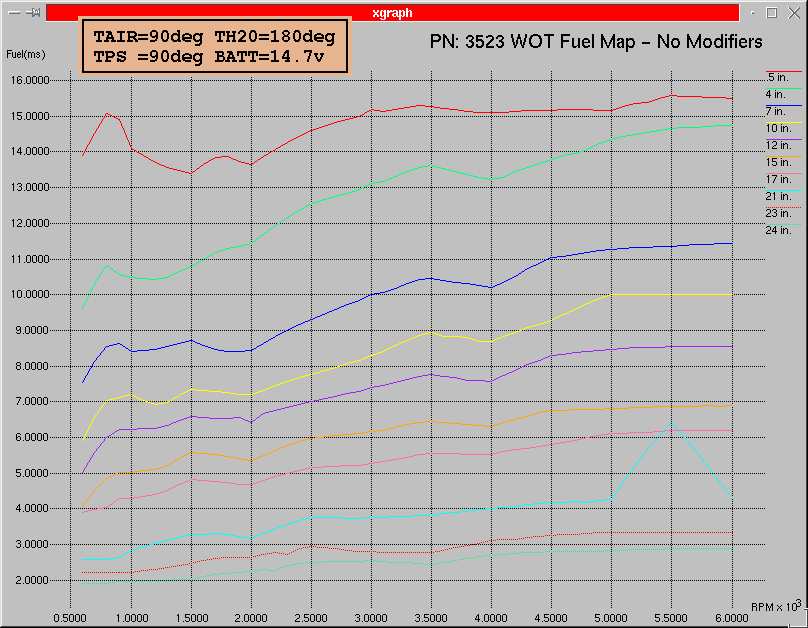
And WOT for the 3523 EPROM.... (Glitch is real !)
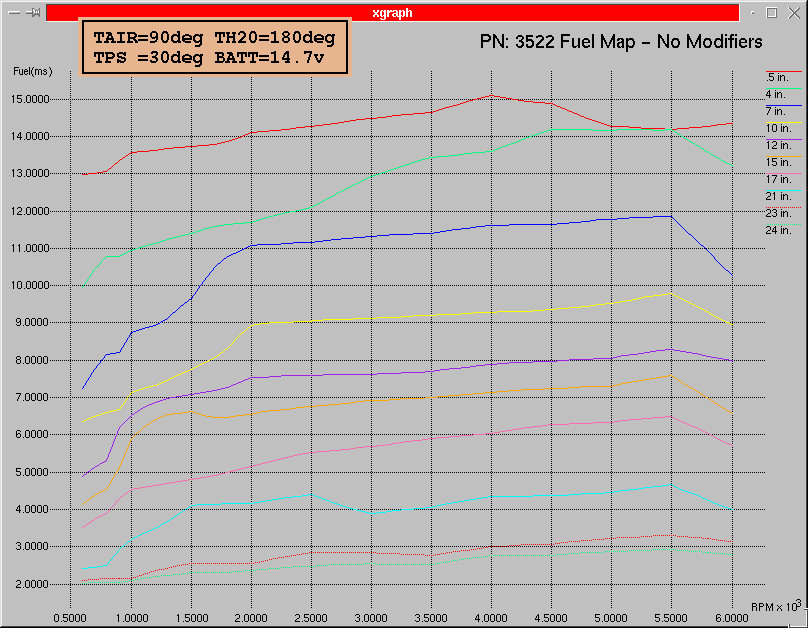
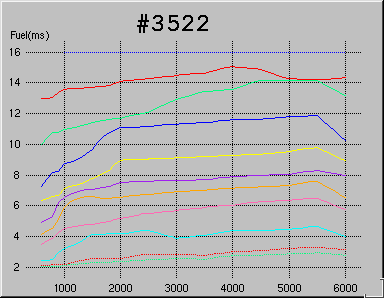
Here is one for the #3522 EPROM. Kind of interesting that this motor needs the same amount of fuel around 5000 rpm at .5 in and as it does at 4 in. I sure wish I could be around when these values were originally generated to see what the design criteria was.
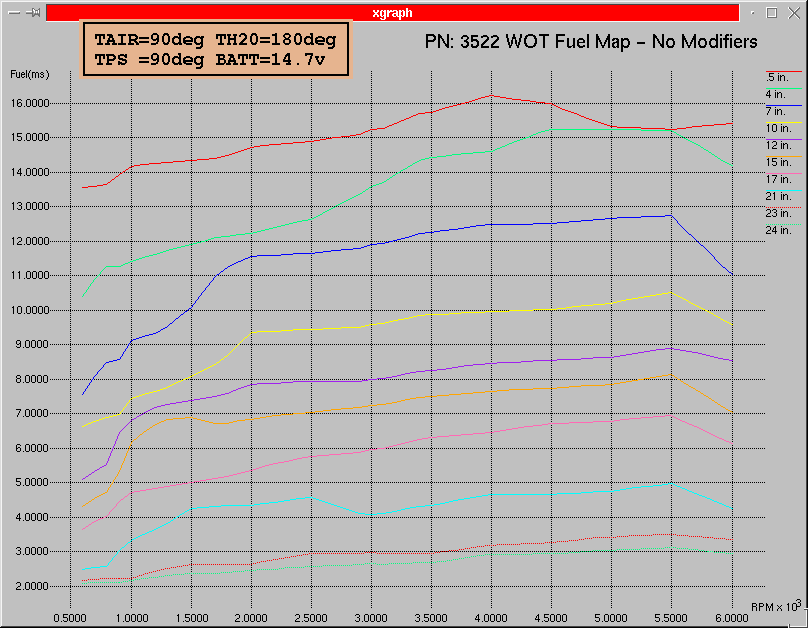
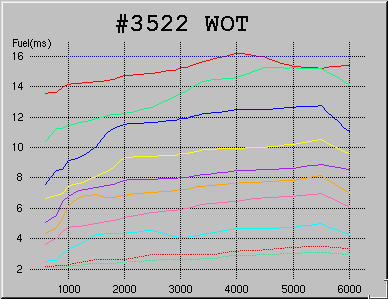
And WOT for the 3522 EPROM....
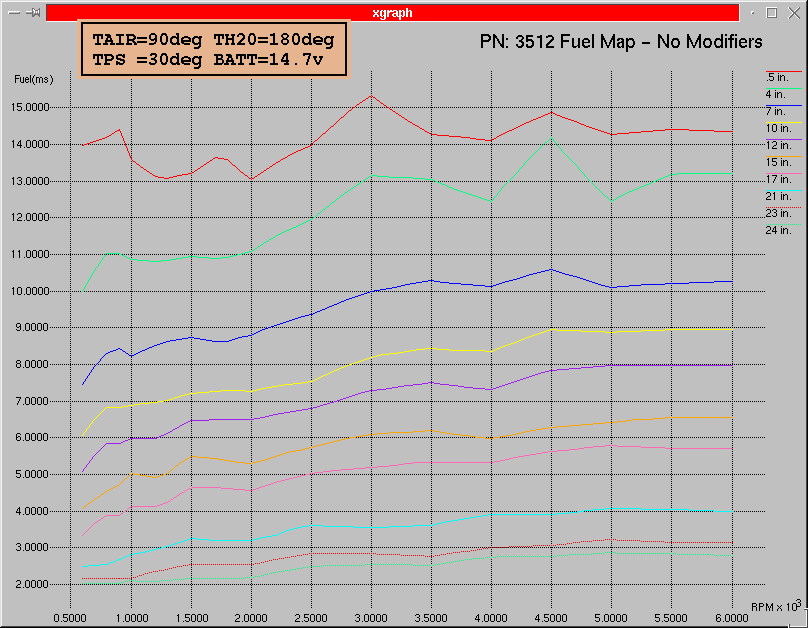
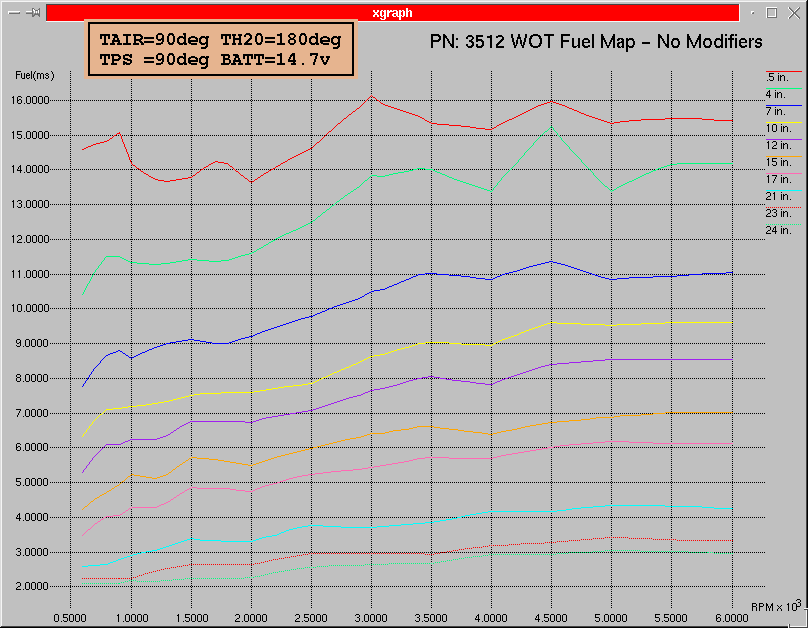
Here are some side-by-side plots on the same scale for easier comparison........
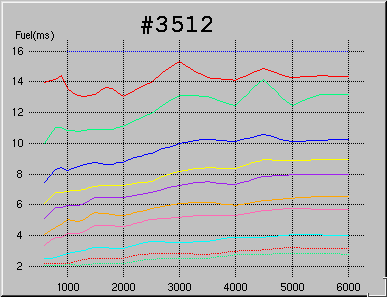 |
 |
|
 |
 |
|
 |
 |
|
 |
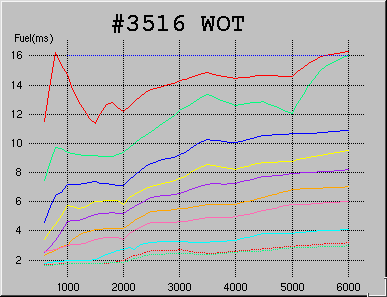 |
Kind of interesting looking at these plots along side of each other. Notice how as the size of the cam goes up the fuel maps get leaner ? On the surface you would think that they should get richer. Don't know if it because an EFI system reacts to the manifold pressure differently than you'd expect. I guess what this really means to keep a given AFR with a larger cam you have to give it less fuel because less air is going into the motor. Doesn't sound right does it. Doesn't feel like it either when you floor it ! Also some of the bumps in the curves are a curious, especially on the 3516 ROM at low RPMs. You wouldn't think that the demand for fuel would change so rapidly over such a narrow RPM range, would you.