Most all of these plots have been generated on my PC running Linux. For the most part the original data is captured in a binary format by my laptop (a HP 800CT Omnibook) running my ECU interface program through the serial interface that normally runs the Edelbrock Controller. From there the binary files are converted into ASCII in a column type format that can be easily inputted into some kind of graphing program. Originally I had written a DOS assembly program to format this data and then imported it into Lotus 123 to generate my plots. Lotus was a bit of a pain because it could only handle about 8000 lines at a time. Also if you wanted to zoom in on an area you had to create a completely new plot. This was back in the days of my last PC, a 486-66 running DOS and Windows 3.1. On this box, a 350 MHz PII running Linux, things run so much faster I can do things much simpler and faster. I've written a Perl script that now translates and formats the raw binary data into ASCII. I then run it trough another Perl script, that I can easily pass options to, that further formats and scales the data before outputting it to 'xgraph'. xgraph is great. There is no line limits and it is so simple to zoom into an area of concern to easily view what is going on. Once the plot is on screen I grab it with a screen capture program (ksnapshot) and save it into a GIF file. If any other pixel pushing is needed 'xpaint' does the trick. For those of you who use Unix/Linux I am sure this is fairly clear. For those of you running Mr. Bill's code I am not sure what you need to accomplish the same thing.
The data presented on most of these plots, and all of the plots that the original data was logged off of the ECU, has been scaled and adjusted slightly to make more compact graphs and to display the data in a little more intuitive manner. Refer to the below plots and explanations for how the data presented is scaled.
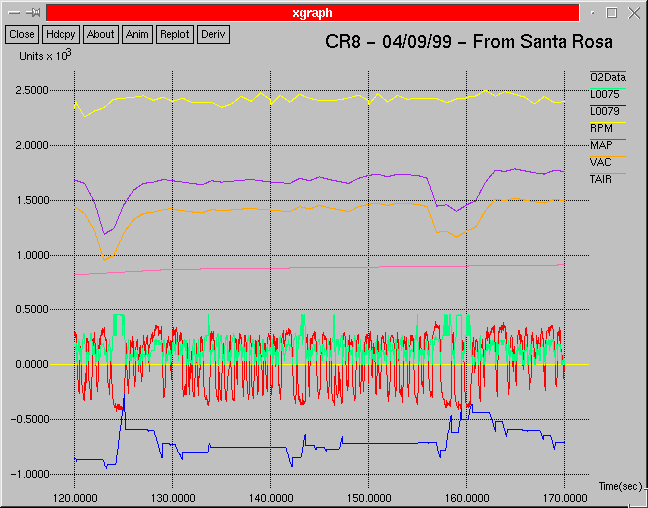
This is pretty typical plot with most items of interest displayed....
| RPM | RPM is the easiest. The 'Y' scale is always correct for the RPM
displayed. In this example the motor is running around 2400 RPM.
# $rpm = int(1875000 / $ign_timing_period); # |
|---|---|
| O2 Data | The O2 error voltage can be presented in two ways, with the 'Y' scaling
always presented in millivolts. Being that the O2 switching voltage
of 447 mv was always one of the main items of interest I generally offset
the O2 voltage by 447 mv. This puts this magic number on the plots
zero reference line, as it is on this plot. The other way the O2
voltage may be presented is without this offset. It is obvious as
to which type you are looking at.
# $o2_adc =int((((($o2_adc-2) * .01953125) / 2.972) * 1000) - 447); # |
| MAP | This line is the MAP ADC value converted into inches.
This is Not the Vacuum that you would see displayed on the controller but
rather what you would see if you had a vacuum gauge on the intake manifold.
It is scaled by a factor of 100 to make for a better graph. So in
our example above the manifold vacuum is around 17 inches. The conversion
formula is:
# MAP = int(((238-map_adc)/8.22222)*100) # |
| VAC | This line is what you would see on the Control Module. It is
the calculated Air Charge presented in inches that the ECU uses in all
of its calculations. It is scaled also to display better so in our
example the air charge is around 14 inches. The conversion formula
is:
# # This is the air charge presented as inches of mercury... # $air = (($tair_adc * 88) / 256) + 99; $map = (($map_adc+32)*184)/256; $air_charge =int((28.9-(($map/$air)*2048*.01152))*100); # |
| TAIR | TAIR is the calculated Air Temperature entering the motor (MAT).
It is scaled by 10 so in our example the MAT is around 85 degrees F.
The conversion formula is:
# # TAIR(degrees) = (ecu_adc * 1.2375) - 103 # $tair = int(($tair_adc*1.2375)-103); # |
| L0075 | This value is what is added/subtracted to/from the closed loop fuel modifier value in L0079. Every ignition trigger event this value is applied to the fuel modifier accumulator. In this plot it gives me an indication of the rate of change being applied. It is scaled by a factor of 10 so in our example the highest peaks are around a value of 45. |
| L0079 | This is the closed loop fuel modifier accumulator. The signed value is applied to the calculated fuel pulse width every calibration loop. This value has a maximum range of +/-16000 counts which represent a -/+20% adjustment in the pulse width. When this value is positive it is decreasing the pulse width. How it is represented on these plots is just the opposite though. It seemed more intuitive to me that when the displayed value was positive it was trying to make the mixture richer and below zero leaner so that is how it is displayed. It is also scaled by a factor of 10 so a value of 1600 on our plot represents a maximum count of 16,000. The example plot shows that it is trying to make the mixture leaner running around 7500 in mid plot. |
| % MOD | This one isn't displayed on the above plot. It displays the L0079 closed loop fuel accumulator (explained above) in terms of percentage rather than absolute value. It is scaled by a hundred so if you see a point say at -1000 you are looking at -10% modification in fuel. |