Razvan Surdulescu (c) 2003
Pipes is a Discrete Event Simulator written in Java. It was written entirely from scratch as a final project for CS380n. It was inspired by HyPerformix's Workbench product, from which it borrows a number of concepts and visual elements.
This document describes the main features of Pipes.
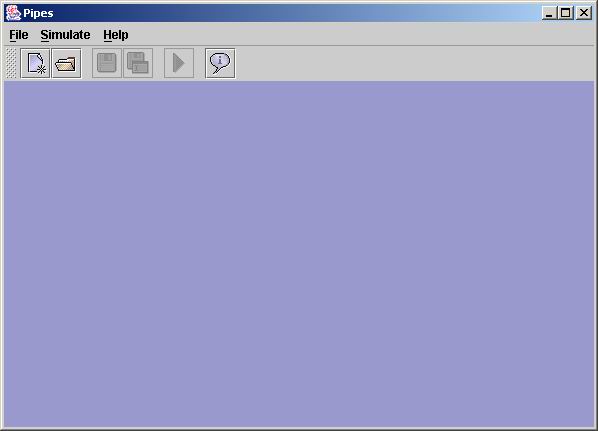
When you launch Pipes, you will be presented with the main product window:
On this window, you can create a new model or load an existing model. Go to
the File menu and select New or click on
the New toolbar button to create a new model:
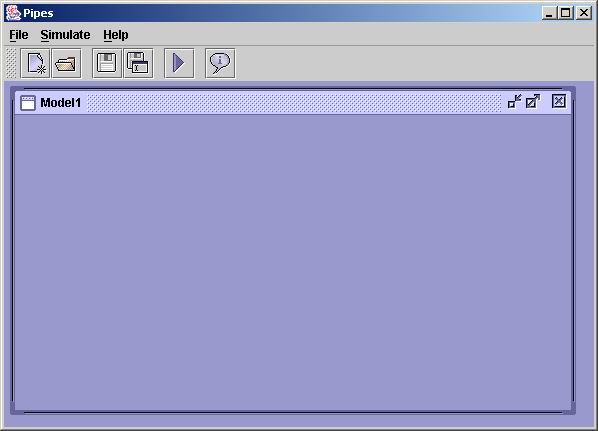
You can load or create as many models as you wish inside the main Pipes window. Each model will have its own window and can be moved, closed or hidden independently.
Right-click on the model window and select Properties
from the pop-up menu to configure the model properties:
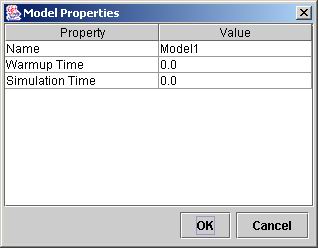
To change a property, double-click in the appropriate cell in the Value
column, type the new property value, then hit Enter. Click OK
to commit the new values, click Cancel otherwise.
Note: you must hit Enter, otherwise the value
will not be committed into the cell! In particular, if you hit OK
without hitting Enter first, the value will not be committed into the
cell.
Here is what each model property means:
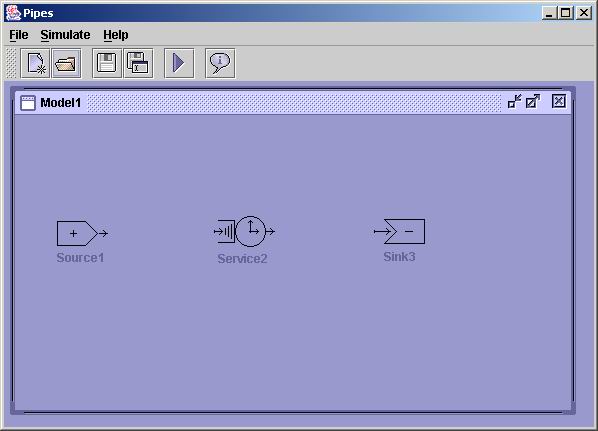
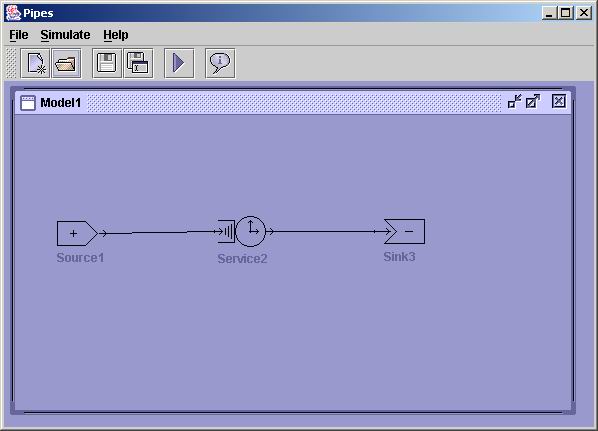
To create a new widget, right-click on the model window and select New
... Widget. Create three widgets: a Source widget, a Service
widget and a Sink widget:
Each widget can be connected to one or more other widgets via arcs. To do this, hover the mouse over an incoming or outgoing arrow in a widget until you see a red square appear; click and hold the left mouse button to start drawing an arc, then release the mouse button on the outgoing or, respectively, incoming arrow of another widget:
You cannot connect an outgoing arrow from a widget to another outgoing arrow from another widget; same for incoming arrows. You can connect a widget to multiple other widgets and multiple widgets can be connected to a single widget.
To change the direction in which a widget is pointing, right-click on the
widget and select Flip from the pop-up menu.
To delete a widget or an arc, right-click on the widget or the arc and select
Delete from the pop-up menu. If you delete a widget, all its
incoming or outgoing arcs will also be deleted.
Each widget type will have different properties that can be customized.
To customize a widget, right-click on it and select Properties.
To change a property, double-click in the appropriate cell in the Value
column, type the new property value, then hit Enter. Click OK
to commit the new values, click Cancel otherwise.
Note: you must hit Enter, otherwise the value
will not be committed into the cell! In particular, if you hit OK
without hitting Enter first, the value will not be committed into the
cell.
Here is what each widget does and what its properties mean.
This widget creates transactions.
[Create New] to create a new category name;
see the Select Category property on arcs below for details.This widget consumes (terminates) transactions.
This widget performs work for some length of time for a transaction.
FIFO means that the first transaction which
arrived into the queue is next selected for processing; LIFO
means that the last transaction which arrived into the queue is next
selected for processing.No Priority
means that transactions are selected according to the Time Rule
defined above; Next Priority means that the transaction
with the next highest priority to the transaction which completed most
recently is next selected for processing; Highest Priority
means that the transaction with the highest priority is next selected for
processing.This widget delays a transaction by some length of time.
This widget provides a consumable, discrete resource.
This widget allocates resources.
FIFO means that the first transaction which
arrived into the queue is next selected for processing; LIFO
means that the last transaction which arrived into the queue is next
selected for processing.No Priority
means that transactions are selected according to the Time Rule
defined above; Next Priority means that the transaction
with the next highest priority to the transaction which completed most
recently is next selected for processing; Highest Priority
means that the transaction with the highest priority is next selected for
processing.This widget releases resources.
To customize an arc, right-click on it and select Properties.
Most widgets have certain properties which are probabilistic in nature. For example, the length of time by which a transaction is delayed at a Delay widget is not necessarily a fixed number: it could be defined according to a probability distribution.
Some probability distributions are defined by a function with a single parameter, other probabilities are defined by a function with two parameters. In all the examples above, Distribution Parameter a represents the parameter for a single-parameter function, whereas Distribution Parameter a and Distribution Parameter b represent the parameters for a two-parameter function. Note that Distribution Parameter b is ignored for a single-parameter function.
Here is what each probability distribution function means:
Fixed(a): returns the value a.Uniform(a, b): returns a value that is uniformly
distributed in the interval a <= x < b; if b <=
a, the call constitutes an error.Normal(a, b): returns a value that is normally
distributed with mean a and standard deviation b.Negative Exponential(a, b): returns a value that is a
drawing from the negative exponential distribution with mean 1/a;
if a is non-positive, a runtime error occurs.Poisson(a): returns a value that is a drawing from the
Poisson distribution with parameter a.Erlang(a, b): returns a value that is a drawing from
the Erlang distribution with mean 1/a and standard deviation 1/(a*
sqrt(b)); both a and b must be positive.Each widget specifies what statistics should be gathered and computed during the course of a simulation.
Although all widgets have the same set of possible statistics measures that can be selected, not all statistics make sense for all widgets. For example, the Response Rate or Response Time statistics do not make sense for a Sink widget since no transactions leave this widget. If you select such (inappropriate) statistics for such widgets, they will output 0 at the end of the simulation.
Here are all the possible statistics types and what they mean:
After you create a model and customize its widgets and arcs, you can simulate transactions passing through this model and compute certain statistics for individual nodes.
To use a concrete example, customize the model you created above as follows:
Source1 node, set the Distribution
Parameter a to 1.0 (Interdeparture Time) and set the Number of
Transactions to 100.Service2 node, set the Distribution
Parameter a to 1.0 (Service Time).Service2 node, check the Utilization
statistic.To start the simulation, you can either go to the Simulate
menu and select Start, or click on the Start
button in the toolbar. The following window will appear:
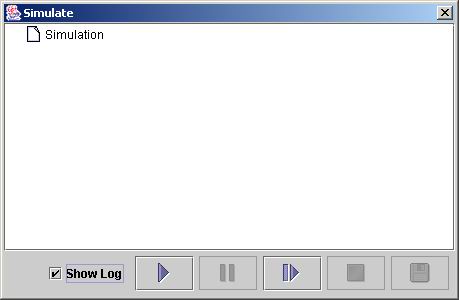
The Show Log checkbox determines whether log messages are
displayed during the simulation. If you have many transactions and many widgets
in your model, it is advisable to uncheck this checkbox since displaying
many log messages is very time and CPU intensive.
The Play button starts the simulation. Once the
simulation is started, you can press the Pause button to
pause it, the Step button to advance it one step at a time,
or the Stop button to stop it.
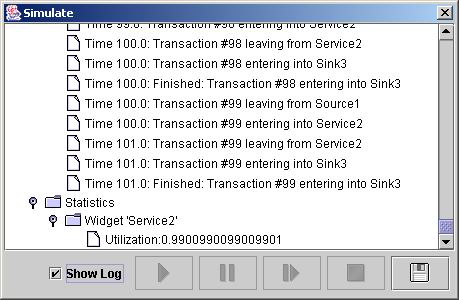
Once a simulation has ended, you can press the Save
button to save the simulation log to a text file.
Here are some of the known issues with this current release of the product: